Powered by Blogger.

Home

Percepts of Prosperity?

Monday, August 28, 2006

The following is a very interesting piece from Rob Kirby at FSO.

==>

Precepts of Prosperity

For those of you who are ‘caught up’ or bought into the notion that the status quo either is or has been great for all of us, please consider the following sage words from Mr. Nelson Hultberg’s wonderful treatise, Contrarians and The Keynesian Myth,


“As recorded in The Statistical History of the United States, real wages for the workingman tripled in the years 1850-1913, and the GDP increased over 500% averaging 4.3% annual growth from 1870-1913. This was all done without any inflationary infusions of fiat money from the Fed because there was no Fed. This highly productive era, based upon the "barbarous relic" of gold, was accompanied by an actual deflation of prices. From 1800 to 1913, there was an overall 30% reduction in the Consumer Price Index from 43 to 30. 6 That's right, we had 4.3% annual growth amidst gently deflating prices all without government fiat money, all without FOMC pooh-bahs, all without today's Gargantua on the Potomac.”

It is not until we view economic growth, productivity and prosperity in this light that one might ‘make the connection’ and realize why economic growth has come to embody what we nowadays accept as such.

One needs to consider that the very nature of all fiat money systems implies that ALL MONEY is, in fact, loaned into existence. This fact [that all fiat loans are repaid principal PLUS interest] dictates that the money supply must FOREVER expand to simply service the existing debt. An ever expanding money supply juxtaposed against the constraints of the earth’s FINITE resources is fundamentally foolish and unsustainable with a completely predictable outcome.

In this light, money growth as we know it is more akin to CANCER – a type of growth that touches so many of our lives – which generally harms [or kills] the host,

Cancer is a class of diseases characterized by uncontrolled cell division [growth] and the ability of
these cells to invade other tissues, either by direct growth into adjacent tissue (invasion) or by migration of cells to distant sites (metastasis). This unregulated growth is caused by a series of acquired or inherited mutations to DNA within cells, damaging genetic information that define the cell functions and removing normal control of cell division. ...

In case any of you are wondering, here’s a graphical depiction of what Central Bankers – cheered on by BIG GOVERNMENT – have done to our money supply:


Fed Res. Chart compliments of Jesse:
http://www.geocities.com/arthurcutten/jesse.html


By observing the chart above, is it not obvious to everyone how closely correlated money supply growth is with virtually everything? Since 1996:


  • Has the stock market not doubled or tripled?

  • Have housing prices not done the same?

  • What about the price of crude oil?

  • How about commodities prices?

  • How about the value or purchasing power of the dollar?

  • Deficits?


Do the words of the Fed, namely,


“….the relationship between growth in the money supply and the performance of the U.S. economy has become much weaker,….”


seem credible to ANYONE?


In the end, perhaps the real question is whether or not we will opt for something resembling the discipline of the gold standard, how long we’ll all be prisoners in our own homes or maybe even how many of us will be lucky enough to be cancer survivors.

Read more...

Mieco: Part VI

In Mieco: Part V, I wrote the following:

Flashback....

In Mieco
What a huge difference! No?

And even if Mieco’s earnings does turnaround… isn't there a possibility that whatever earning derived from its new plant might be used to pay for its debts? And if so, what’s left then for the investor?

How?

Mieco last traded at 1.37. Its warrants closed at 0.50.
Still think
that now is an opportunity to invest in the stock?

How about avoiding?
How about selling?

Yes, again… there is no doubt that when Mieco’s new factory is fully operational, there is a huge possibility that Mieco’s earnings will turnaround.
But the biggest issue is: WHEN!

When?
Bila?

Consider this.. if Mieco’s new plant needs another 6 months or so to start producing (if only hor.. me have no idea when its factory is ready) and in the meantime Mieco’s quarterly earnings continues to decay...just imagine what would happen to Mieco’s share price? Isn’t there not a possibility that the share price might continue to drop some more if and if Mieco’s earnings does not improve?

Isn’t it more prudent to avoid the share until we have better earning visibility?

Why be a hero in a hard place?
Why take such unwarranted risk in the stock market?

Do we want to end up as a zero?
Think about it
dude… :D


---------------------
28th Aug 2006.

Mieco last traded today at 0.985 sen!

Mieco reported its quarterly earnings today, reporting a net earnings of 2.891 million.

Remember, the first sign of weakness was stated in Mieco. Quote: "As noted, the first sign of weakness in the company’s earnings happened when Mieco announced its 03 q4 earnings on 24th May 2005"

And this is what i stated in Mieco: Part V. Quote: " Isn’t it more prudent to avoid the share until we have better earning visibility?"

So we have the inital sign of earnings turning.

But the balance sheet is still looking awful!

Loans total over 220 mil. Piggy bank cash is a mere 18.8 million only.

How?

Read more...

Top Glove fined

Friday, August 25, 2006

Well the fine was expected when the law was broken.

Top fine for Top Glove Corp

  • PUTRAJAYA: A whopping RM11.4mil fine! That is the amount that Top Glove Corp Bhd, which was caught with 1,769 illegal workers on Aug 16, will have to pay.

    It is the largest fine ever imposed on an employer for hiring illegal workers in the country’s history.

    Immigration enforcement chief Datuk Ishak Mohamed said the Klang-based glove-making company has also been asked to pay RM2.3mil in outstanding levies for the illegal immigrants they hired.

    Ishak said the previous record fine of RM500,000 was imposed by the Johor Immigration Department on a construction firm for a similar offence in 2000.

    On Aug 16, Ishak led a raid on the factory which was found to have hired more than 1,000 illegal foreign workers who were either working without permits or with expired permits.

    However, the department did not detain any of the illegal workers to ensure that the company, which is public-listed, could fulfil its overseas orders.

    “I urge the public to continue to help the authorities identify unscrupulous employers. In the case of the rubber glove manufacturer, we were successful because we were tipped off,” he added.

    Top Glove executive director K.M. Lee said last night the company would appeal on Monday for a reduced fine.

    “There are a few mitigating factors. Firstly, the workers came in with proper papers. “Not a single one of them came in without a passport,” he said.

    Secondly, it was an administrative failure on the part of the company and it was not intentional. Thirdly, when the company discovered the problem last month, it took steps to renew their papers, he said.
It would be nice to see the law be enforced and that Top Glove's appeal be rejected. The bottom-line is they broke the law and if the authorities are not strict on such issues, how do we expect a better future?

Think about this...

Laws would be totally useless if they can be broken and easily appealed.

Read more...

Sunrise or is it sun down?

Monday, August 21, 2006

I remember this stock.

This was one stock which a couple of years back had tons and tone of conversion of ICULS. So despite its goods earnings, the earnings was always diluted for the minority shareholder.


The earnings was always diluted for the minority shareholder.

The above chart explains it so clearly. If you look at the one-year chart of Sunrise, this looked like a decent stock, right? See the lows of 1.20? It closed yesterday at 1.51. What's wrong?

Yeah, so what's wrong. Consider this. In fy 2004 Sunrise made 33.359 million. In fy 2005, it made a whopping net earnings of 104.692.

Given any other stock, such performance would have warranted Sunrise to be one gem of a stock.

But... Sunrise had this ICUL worth some 74.167 million and some 18.000 million ESOS. There is one nice table one can see clearly what I am talking about...

Sunrise had a 3 for bonus issue: see this
link (click on the attached table)

Assuming no conversion of ICULs, Sunrise would have 302.298 million.

But after conversion of ICULS, which means after the entitlement of the 3 for 5 bonus issue too, Sunrise should have 449.765 milllion.

Difference? Dilution caused by 147.467 million shares. And based on 302.298 million, this meant 48.8% new shares were issued! Or 48.8% dilution in earnings. (sunrise today, shows it has 424.534 million shares)

Isn't it clear why despite the incredible earnings performance from Sunrise, where the earnings almost tripled, the minority shareholders didn't really benefit as much?

Is this what they call share market?

Does the minority shareholders feel that wealth is being shared?

This was one huge reason back then to avoid the stock. It simply wasn't worth it.

Now Sunrise reported its earnings yesterday. It wasn't too nice.

http://sahamas.net/view_topic.php?id=497&forum_id=28

What's even not too nice was the manner they lost the money and the manner the management is treating the issue.

Sunrise bullish on prospects for FY07
By Thomas Soon, 21 Aug 2006 10:10 PM

Sunrise
Bhd is bullish on its prospects for the current financial year ending June 30, 2007 after making a prudent provisioning for one-off impairment losses totalling RM87.4 million in the previous year


I am going to write my comments in red.

Sunrise Bhd is bullish on its prospects for the current financial year ending June 30, 2007 after making a prudent provisioning for one-off impairment losses totalling RM87.4 million in the previous year. ( 87.4 million impairment losses. Wonder what is impairment losses?!! )

Due to the provisioning, the property developer posted a loss after tax of RM58.69 million for the three months to June 30, 2006 against a profit after tax of RM30.31 million a year earlier. Profit after tax for FY06 fell to RM4.53 million from RM104.35 million in FY05.

For FY06, Sunrise posted a revenue of RM359.2 million, which is about the same level as the previous year. Despite the provisioning, Sunrise declared a first and final gross dividend of 6 sen per share.

The impairment loss of the historical assets involved two parcels of leasehold land in Kajang (RM67.4 million), a piece of land in Mersing (RM8.4 million) and the land on which stands the American International School at Carlington in New South Wales, Australia (RM11.6 million).

The parcels of land in Kajang and Mersing were bought in 1996 and 1994, respectively. The impairment loss was done after a recent revaluation exercise by professional valuers, while the provision on the Australian operation was done after its decision not to continue the loss-making operations of the school. (Oh my god!! Bought in 1996 and 1994. Say, now is 2006. Impairment loss for assets bought some 8-10 years ago. So where is the professional valuers then? And how could the impairment losses be so huge? Huh? Huh? Huh? )

Sunrise executive chairman Tong Kooi Ong said the provision did not in any way affect the group's sales, operations and cash flows. He said its management decided on the provision in line with a more prudent practice. (excuse me, is this what you call prudent? How about an attempt to explain what happened 8-10 years ago? Where was the professional valuers then? And how could the impairment losses be so huge? An impairment loss of 67.4 million for 2 pieces of leasedhold land in Kajang bought 8-10 years ago is totally astonishing! What happened? Don't the shareholders have the right to know? )

Read more...

Crest Builder


Crest Builder just announced its earnings. It's impressive..

   Crest Builder Holdings Bhd (8591.KU) - Malaysia
2nd quarter ended June 30:
Figures are in Ringgit (MYR).

2006 2005
Revenue MYR54,119,000 MYR63,443,000
Pretax Profit 6,590,000 5,464,000
Net Profit 3,695,000 2,923,000
Earnings Per Share 3.00 Sen 2.60 Sen
Dividend Omitted Omitted

6 months ended June 30:

Revenue 113,017,000 116,893,000
Pretax Profit 15,248,000 12,844,000

Net Profit 9,322,000 8,048,000
Earnings Per Share 7.70 Sen 7.10 Sen
Dividend Omitted Omitted
 

Crest Builder closed at 0.97 sen. Down 2 sen.

Ok, so what's wrong?

Crest Builder current earnings of 9.322 million for its first 2 quarts of current fiscal year its much more than what Crest Builder did last fiscal year same period. Crest Builder managed 8.048 million for last fiscal year.

Well..

Remember this blog posting: Ze Numbers Game: II

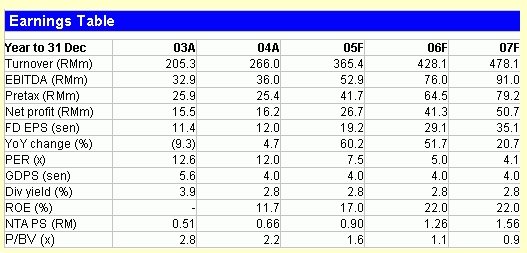
So Crest Builder although doing 'ok' and perhaps 'good' with half year earnings totalling 9.322 million but just how good is this earnings when OSK numbers is projecting an astonishing earnings of 41.3 million for full year fy 2006!!!!!!!

So what do we have??

Ahem.. 'lost' research report.. amazingly 'flying sky' earnings projections...

Have a read again:


Back in April 2005, OSK wrote about Crest Builder. Price back then was 1.44. OSK gave it a price target of 2.59.

And I wrote that blog posting,
Ze Numbers Game on Nov 2005.

Here is an extract of what I had written then.

<=============>

And this is how OSK valued Cresbld:

  • However, by taking into account only the basic shares outstanding, we obtained a fair value of RM2.59 based on FY06 earnings, which provides an upside of 72.7% to its current share price.

ahem!

See onot?

And they based it on fy 2006 earnings! Earnings which went bang! bang! bang! like this below:

15.5 -> 16.2 ->
26.7 -> 41.3 -> 50.7million.

Fiyoooh... 41.3 million!!!

Incredible isn't it?

2005 FY projections is already perhaps a bit too optimistic at 26.7 million... but no... OSK did not based their valuations upon those numbers
but instead they based it at an even more optimistic earnings of 41.3 million!!!!!!!!!!!!!!!

Now wouldn't u say that this is a bit too optimistic?

And when they make such optimistic projections, this simply allows them to create a stock with such a great upside potential (72.7% wor!) when they make their so-called BUY recommendation!

ps. Cresbld closed at 0.795 today. (back in Nov 2005)

<=============>

And how did Crest Builder did for its fiscal year 2005? Well have a look at its last reported quarterly earnings on Feb 2006.

Crest Builder made a net profit of only 12.198 million.

And how did OSK played ze number game?

Well the table below says it all...

OSK had projected an earnings of 26.7 million! Crest Builder only made a net profit of only 12.198 million.

Now check this out, today OSK has a brand new report on Crest Builder again.

Price of Crest Builder is now 1.12 and OSK has given it a 12-month target of 1.49.

LOL!!!... yup... just 1.49! (ps. In April 2005, Price back then was 1.44. OSK gave it a price target of 2.59!)

Wait... check this out too.


Ahem.. can you see that they have projected an earnings of 31.9 million for Crest Builder's fy 2006 earnings and an earnings of 35.2 million for its fy 2007.
(last April 2005, OSK projected 41.3 million!! Does this mean they are less optimistic? LOL!)

And as stated in OSK own table, this translates to a 161.7% increase in earnings for this fiscal year!

So for a stock that had a whopping decline of 25% in fy 2005, is projected to grow 161.7% this fiscal year.

Highly incredible, isn't it?

Now check this out also...

The below is a screen-shot of their reasoning...


Did I miss a report on Crest Builder since last April 2005? This is because the writer is saying:

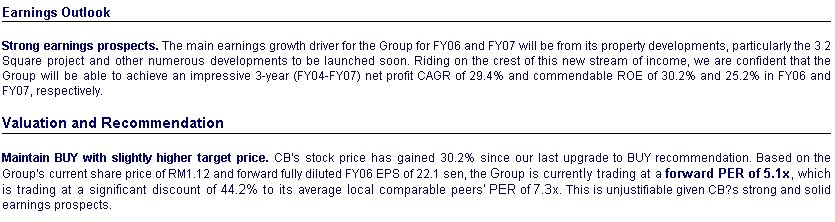
  • CB's stock price has gained 30.2% since our last upgrade to BUY recommendation.

Ps... does someone have a copy of that report? ... cos I find it really strange since I can't even search for this report in their archives.

  • Group is currently trading at a forward PER of 5.1x, which is trading at a significant discount of 44.2%

It would be good to note that it is CHEAP because their forward PER of 5.1x is based on an earnings which is projected to grow 161.7% this year!

LOL!! Any stock which can grow so much would surely be cheap. Yes or not Shirley?

:D

Read more...

Regarding Scomi Group again.

Friday, August 18, 2006

Dedicated to The Killer! :-)

On 6th May 2006, I wrote the following:

I had actually made a posting on Scomi Group before. Let me reproduce what I have written on it. ( Sorry dude, it's just have gottabe long! )

<<==>>

Firstly, I have to say this. IPO subsribers to SCOMI would be really darn please with their investment if they held the stock from the start to now!

Scomi was offered to the public at a price of 1.38. Listed on May 2003.

In April 2004, there was a 3 for 5 bonus issue and then a 1 into 5 stock split.

  • 08/04/2004 Entitlement - Others

    For illustrative purposes, a shareholder holding 100 ordinary shares of RM0.50 each in SCOMI on the Entitlement Date shall be entitled to 60 ordinary shares of RM0.50 each in SCOMI pursuant to the Bonus Issue. Subsequently, his/her entire 160 ordinary shares of RM0.50 each shall be subdivided into 800 new ordinary shares of RM0.10 each in SCOMI.

So say, for simple illustrative purpose, someone subscribed to 5,000 shares of Scomi at 1.38 during Scomi's IPO, their capital outlay will be 1.38x5 = 6900.

So after the stock bonus, this investor would now hold 8 lots of Scomi. And after the stock split, the investor would be having 8x5 = 40 lots or 40000 shares.

So at closing price of 1.17 (this was the price of Scomi on 3rd Sept 2005), this investor's investment would be worth 46,800.00.

Which is really a darn good investment return!!!

And the picture below says it all!
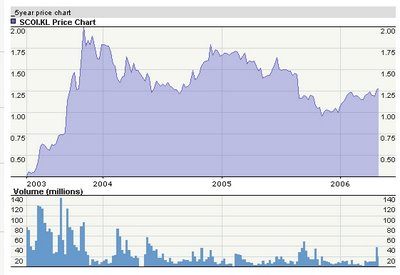
So how did Scomi do since its listing?

For its fiscal year 2003, Scomi Group announced an earnings of 14 million.
For its fiscal year 2004, Scomi Group announced an earnings of 61.4 million.

Absolutely commendable. In fact, some would call it as brilliant!

So for the IPO investor, buying the stock of Scomi is looking at his/her company's net profit grow from 14 mil for fy 2003 grow to a very impressive 61.4 million for fy 2004.

Basically, isn't this what we all want in a company when we invest in it?

The company is making more and more moola each year!

Rite?

Now the question is or rather the issue is, we all know that Scomi is growing explosively via acquisition of companies or some would cynically call it the engineering of profits via acquistions.

Anyhow, I guess it would do no harm and it would makes sense if we dig deeper, rite?

And this can be done via some simple observation of its quarterly performance. Just some simple comparison of some key figures.
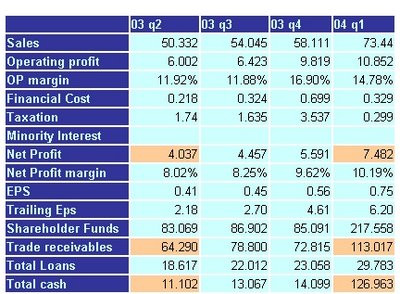


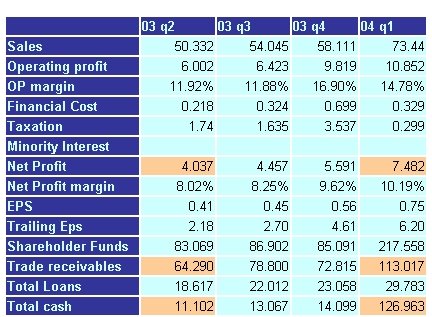
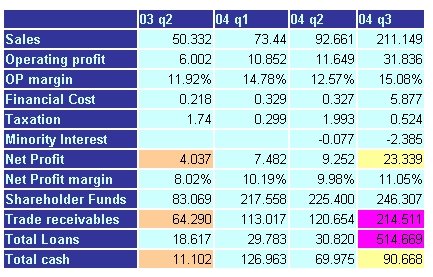
At the start (03 Q2 ), we were looking at a company with the following characteristics...

  1. Company was making about a quarterly net profit of 4 million.
  2. Cash was 11.102 million versus Total loans of 18.617 million. (a net debt position of 7.515 million)

Next we look at 04 Q1...

  1. Company is now making around 7.4 million per quarter. Fantastic.
  2. Cash is now 126.963 million with loans of 29.783. (net cash of 100.180 million). Fantastic.
  3. Slight worries. Trade receivables is now 113.017 million.

A very interesting footnote was found in the cash flow statemtent:

  • 125 million was generated VIA SHARE PLACEMENT EXERCISE and entered into the company's piggy bank.
Let's watch what happens next...


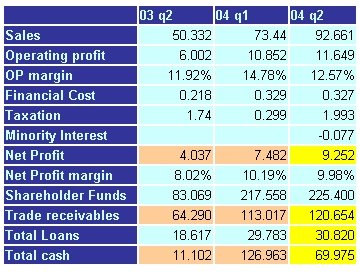
Now we are looking at 04 Q2.

Good points.
  1. Net profit is now 9.252 million. Just the same quarter, a year ago, Scomi was just a company making 4.037 million. Company is making more money isn't it?
  2. Cash stands at 69.975 million versus total loans of 30.820 million. (A net cash position of 39.155 million).
Fantastic isn't it?

But here comes the worrying part..

  1. Trade receivables is now at 120.654 million. (Hmmm... a worrying signal? Hard to say at this moment of time cos after all this quarter Scomi showed a sales revenue of 92.661 million.)
  2. Cash flow. Starting cash was at 126.963 million. A quarter after a share placement issue, in which Scomi generated 125 million in this fund raising exercise. At the end of the quarter, cash is only at some 69.975 million. Where ze Moola go???? (ah ze classical arguement of a company using leverage to expand and grow the company!)

Scomi reported that earnings on 11th Aug 2004.

Let's watch happens in Scomi's next quarter, 2004 Q3.

Good point:

  1. Net profit is now 23.339 million. 5 quarters ago, Scomi was just a company making 4.037 million. Company is making more money isn't it? Isn't this what u call explosive growth?

Fantastic isn't it?

And again, here comes the worrying part...

  1. Trade receivables is now at 214 million. (Hmmm... again a worrying signal? And again hard to say cos Scomi had sales revenue of 211 million for the quarter and since with the company made making more sales, more receivables is accumulated, rite?)
  2. Cash is now at 90.668 million but the loans is now 514.669 million. Scomi is now in debt of 424 million!!!! ( A huge worry? )

A flag has been raised, eh? Them same old worrying issues is getting more worrying, isn't it? Time to exit da bugger?

Scomi reported that set of arnings on 3rd Nov 2004.

Next quarter, 2004 Q4 was pretty dull. Pretty much the same old, same old. A neither here or there quarterly earnings report.

So fast forward to 2005 Q1 earnings. Which was really 'interesting'..
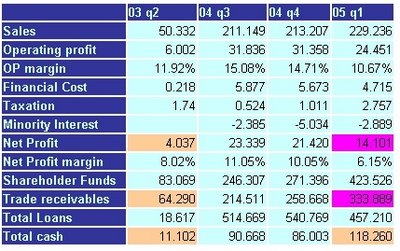

Soooooo many issues!!!

1. Net Profit is only 14 million? Big worry? Down from 20+ mil on a q-q basis...
(ahh.. again... some will argue cos on a y-y comparision.. this 14 million net profit is still much better than the 7 million it earned a year ago).

2. Trade receivables is now 333.889 million. Now this trade receivables is NOW a huge worry cos quarterly sales is now 229.236 million only. Where is that extra 100+ million of receivables coming from? What if a huge portion of these trade receivables turn bad? Bad debts then?

3. Loans? Loans is now 457 million. Down from 540 million a quarter ago.

4. Total cash increased to 118 million from 86 million a quarter ago.

5. Is 3 and 4 a good point? My answer is NO. If one looks at Scomi's Cash flow, Scomi's made yet another share placement to raise cash. A placement which saw Scomi raised 145.476 million.

So what we have is:

Scomi raised cash from placement of shares which is then used to pay off some of its loans....

But how does one evaluate Scomi's earnings performances? Surely if one is a buyer of Scomi's placement shares, one would probably not be too happy with it cos the bottom line is Scomi's net earnings declined from 20+ million to just 14+ million.

Now given 1,2, 3 and 4 and most importantly point 1, Isn't the time to really to exit this bugger?

Scomi reported this earnings on 25th May 2005.

Scomi closed at 1.40 on 25th May 2005.

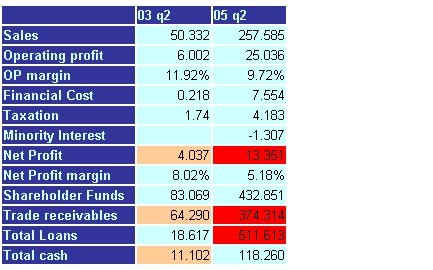
And here comes the company most recent earnings (in Sept 2005)
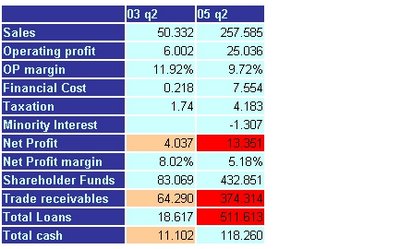

And how did Scomi do?

1. Net earnings came in at 13.351 million. Which was down from 20 million plus earnings it earn a couple of quarters ago...

Now why issit such a huge worry?

1. Trade receivables is now a whopping 374 million.

2. Loans. Total loans is now 511 million.Up from a total loans of 457 million a quarter ago. Hmmm.... if one looks at the bigger picture, Scomi did a placement, paid of some 80 million plus in loans but come the next quarter, it borrows yet again. Doesn't it mean that Scomi is now back at square one? At the peak, Scomi total loans once stood at 540 million!!!

How? Now Scomi has been on a sell-off since May. Down some 30% and it is not too surprising eh?

Let's re-examine what has been said.

At the start (03 Q2), we were looking at a company with the following characteristics...

  1. Company was making about a quarterly net profit of 4 million.
  2. Cash was 11.102 million versus Total loans of 18.617 million. (a net debt position of 7.515 million)

8 quarters later, after countless of acquisitions and 2 share placement and sooooooo many ESOS....

We are now looking at....

1. A company making 13 million per quarter.

Compare to the 03 Q2 in which Scomi made only 4 million. An increase of 9 million So company is making 3.25 times more moola.

2. Company cash balance is now 106.119 million. Total loans stand at 511.613 million. Company is now in a net debt of 405.494 million.

Comparison. In Q2, company net debt position was a mere 7.515 million. Now the net debt position has increased by a WHOPPING 53X.

Justifiable given its current earnings? (some would ask: Does it make sense to increase ur total debt position by 405 million to make that extra 9 million in profit???? )

how? how? how?

Would it be wrong to say that this is an insane strategy employed by Scomi????

Oh btw, Scomi now has 991,130,700 shares. How signifacnt is this? Well, back in 03 Q2, Scomi Group had just around 91 million shares! ;p

<<==>>

That was back in Sept 2005. Sorry mate to bore you with all those details but I do reckon that it is useful to understand why Scomi rose so high and why its share price was declining quite a lot late last year (Scomi traded as low as 0.95 back in Nov 2005!).

Anywayyyyyyyyy...

In Nov 2005, Scomi announced its Q3 earnings. Scomi quarterly net earnings increased to 16 million.

In Feb 2006, Scomi announced its Q4 earnings. Scomi quarterly net earnings increased to a whopping 109.539 million!!!

So let's look at how did Scomi do since its listing...

For its fiscal year 2003, Scomi Group announced an earnings of 14 million.
For its fiscal year 2004, Scomi Group announced an earnings of 61.4 million.
For its fiscal year 2005, Scomi Group announced an earnings of 151.692 million.

And there you have it mate, yes it is true that Scomi has an astonishing growth rate!

But how about them points again? Well, as at its last reported earnings...

  1. Cash is at 87.595 million.
  2. Trade receivables has increased to 438.430 million.
  3. Group's borrowings is not at 918.363 million.

And yes, I do understand your issue that leverage can be used to generate a much higher revenue but on the other hand, I do hope you realise that this leverage issue is a matter of personal views and opinions. Me, for one, believe that too much leverage can turn deadly if one is not prudent enough.

And by the way, from my live quotes, I do note that as of today, Scomi Groups' number of shares is now 996.208 million shares!!

Yup, it increased yet again. Which means based on this enlarged share base, Scomi's current eps is now 15.2 sen. Ok?

And yes, I had mentioned the perils of a company issued placement shares.

Currently, Scomi does have the earnings to justify its strategy but do remember what happened back then in Sept 2005. Look at how the share tumbled when the earnings wasn't there. Do take note of this issue. It could well happen yet again but then on the other hand, if the Scomi 'produce' those earnings, the market could well go ga-ga over the share again.

Cheers!

<===============>

19th Aug 2006

Scomi reported its 2006 Q1 Earnings on 25th May 2005.

Quarterly rpt on consolidated results for the financial period ended 31/3/2006

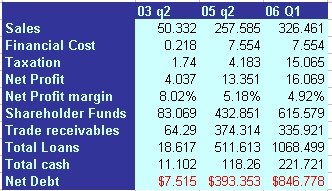
The following table simple table says it all. There different point of time to highlight the progress of Scomi Group as a company.
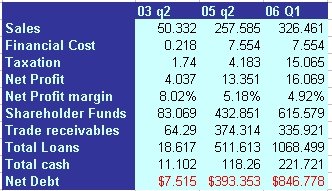

Look at the sales and net profit numbers.

Yes, the sales and net profit has increased a lot but do you see any creation of wealth?

Back then, 03 Q2, Scomi Group was a simple stock earning 4.037 million for the quarter. But it's net debt was a mere 7.515. Very manageable.

Today Scomi? 06 Q1, Scomi Group is now a complex Godzilla, earnings some 16.069 million for the quarter, which is about 4 times more than it earned back in 2003 Q2. Fantastic. Bravo. But just look at the cost of such engineering of wealth. Scomi Group is now in a nett debt positiion of $846.778 million.

How?

Read more...

Them NEW expressions.

I really like Martin Goldberg's commnets on them New expressions mentioned in his Market Wrap.

Finally, the “New” expression… You know, “age 40 is the new 30.” “Oil at $70 per barrel is the new $50.”

Here are a few more "New” expressions.

  • Cisco is the new Radio Corp.
    Buybacks are the new dividends.
    A P/E of 20 is the new 10.
    The iPod is the new Walkman, is the new 8-track is the new reel to reel.
    Middle class is the new poor.
    The corporate-owned press is the new independent press.
    Greenspan is the new John Law.
    Bernanke is the new Greenspan.
    Regarding dividends, 1.5% is the new 3%.
    Speculation is the new investment.
    Debt is the new savings (so is home equity)
    Wal-Mart is the new Woolworths.
    General Motors is the new Chrysler.
    Toyota is the new General Motors. (The Camry is the new Impala.)
    Economic statistics are the new lies.
    Financial engineering is the new research and development.
    ……………. is the new Enron.
    World domination is the new world peace.

How true eh?

The brand NEW world.

Read more...

  © Blogger templates Newspaper by Ourblogtemplates.com 2008

Back to TOP